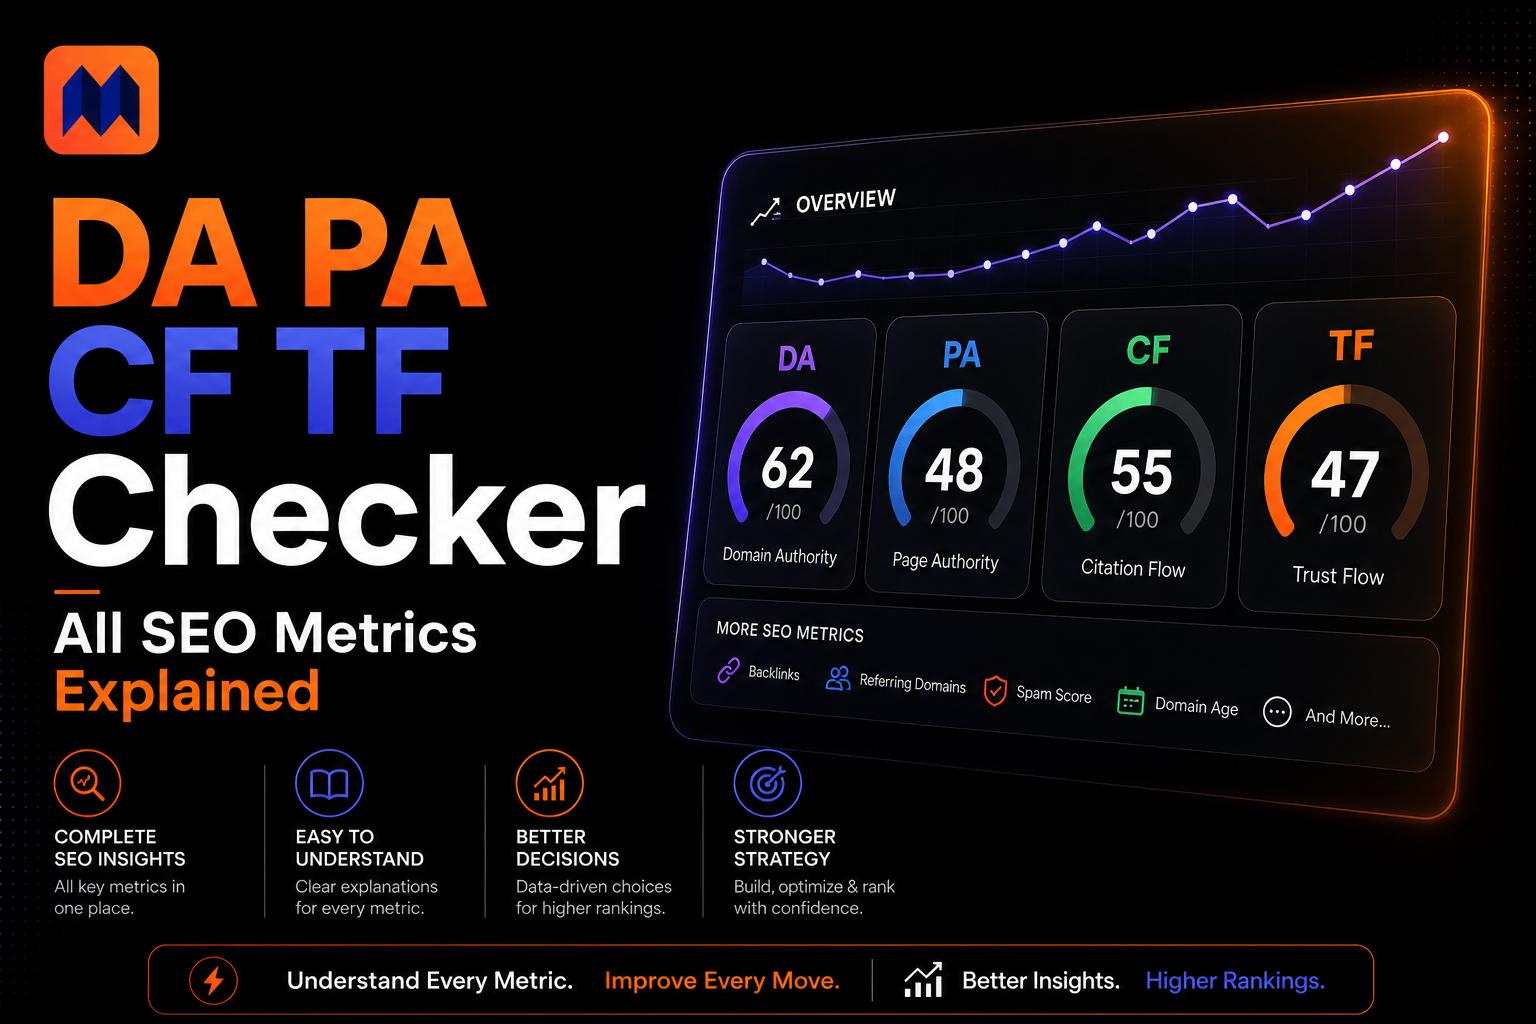
DA PA CF TF Checker — All SEO Metrics Explained
You open a DA PA CF TF checker and six different scores stare back at you. All of them claim to measure authority. None of them match.
Most people pick the highest number and move on. That’s how you end up linking to sites that look strong on paper and do nothing for your SEO.
This guide explains what every metric actually measures, how each one is calculated, what the numbers mean in practice, and which one to use for which job.
But you can check our Da/Pa checker Tool
All Six SEO Metrics — Quick Reference
Three tools. Six metrics. All measuring “authority” through completely different lenses. Here’s the full picture before we go deep on each one:
| ID | Tool | Scale | What It Measures | Update Cycle |
| DA | Moz | 0 – 100 | Domain-level ranking potential (multi-signal ML model) | Monthly |
| PA | Moz | 0 – 100 | Individual page ranking potential | Monthly |
| CF | Majestic | 0 – 100 | Backlink volume — how many links point to a site | Varies |
| TF | Majestic | 0 – 100 | Backlink quality — links traced from trusted seed sites | Varies |
| DR | Ahrefs | 0 – 100 | Domain backlink strength (domain-level PageRank) | 12 – 24 hrs |
| UR | Ahrefs | 0 – 100 | Page backlink strength (page-level PageRank) | 12 – 24 hrs |
The split is clear: Moz covers ranking potential, Majestic covers link quality and volume, Ahrefs covers backlink strength. Each answers a different question about the same website.
A site can score well on one and poorly on another without either number being wrong. They’re just looking at different things.
Domain Authority (DA) and Page Authority (PA) — Moz
Moz built DA and PA to do one thing: predict how likely a domain or page is to rank in Google. Both use a logarithmic 0–100 scale. The gap between 60 and 70 is far harder to close than between 20 and 30.
Domain Authority (DA)
DA puts a number on an entire domain’s competitive strength. Moz pulls backlink data into a machine learning model trained on real Google search results, not a formula Moz made up internally.
The model weighs referring domains, link quality, Spam Score signals, and other factors Moz keeps partly undisclosed. The output is a relative score — meaningful only when you compare it to competitors in the same niche.
Four things most guides get wrong about DA:
• Google doesn’t use it. DA is Moz’s prediction, not a ranking signal. A DA 15 site outranks DA 60 sites routinely when the content matches intent better.
• It updates once a month. Build links this week and your score won’t move for 3–4 weeks. Don’t use it to track active campaigns.
• It’s comparative, not absolute. DA 35 is strong in some niches, weak in others. Benchmark against whoever ranks above you, not an arbitrary target.
• Moz has the biggest index. Around 44.8 trillion links crawled as of 2025, larger than Ahrefs’ 35 trillion. More coverage means fewer blind spots.
Page Authority (PA)
PA works the same way as DA but scores a single page. A domain at DA 50 can have a homepage at PA 60 and a product page at PA 14. They’re different numbers from the same model.
For link building, PA matters more than DA most of the time. The link you want comes from a specific page — that page’s PA tells you how much authority it can pass. A high-DA site with a low-PA inner page is a weaker link than it looks.
Moz also gives you Spam Score alongside DA and PA. It shows what percentage of spam-like signals a domain triggers based on patterns common among penalized sites. No other tool covered here offers anything equivalent. Use it every time you vet a new domain.
Citation Flow (CF) and Trust Flow (TF) — Majestic
Majestic built CF and TF to split something most tools lump together: how many links a site has versus how trustworthy those links are. Quantity and quality are not the same thing.
Reading one without the other is where most SEOs go wrong.
Citation Flow (CF) — The Volume Score
CF measures link volume. A high CF means a lot of sites are linking in. It’s not purely a raw count — links from high-CF sources carry more weight than links from low-CF sources. But quality barely enters the picture.
A site covered in blog comment spam and forum profile links can have CF 50. A brand-new legitimate business site might have CF 8. CF goes up quickly when you acquire links, regardless of where they come from.
This is why CF alone is useless for site evaluation. You need TF alongside it to understand what those links are actually worth.
Trust Flow (TF) — The Quality Score
TF starts from a manually curated seed set — websites that Majestic’s team has verified as genuinely trustworthy. Think major news outlets, established institutions, well-known industry authorities.
Authority flows outward from those seeds through the link graph. Get a link from a seed-set site and your TF climbs. Get a link from a site that got its links from spam directories, and your TF barely moves. The chain matters, not just the link.
TF is harder to fake than DA, DR, or CF. Research published in 2024 found that DR could be inflated to 50+ for under $100 using link farms. TF manipulation takes longer, costs more, and Majestic has manually reset inflated scores after detecting them. It’s not tamper-proof, but it’s more resistant than the alternatives.
The TF/CF Ratio — The Number That Actually Matters
The ratio between TF and CF tells you more than either score alone. Divide TF by CF and you see whether a site’s links are genuinely trustworthy or just numerous.
| Pattern | Signal | What to Do |
| TF close to CF (ratio ~1:1) | Strong | Rare and healthy. Almost every link comes from a trusted source. |
| TF is half of CF (ratio ~2:1) | Average | Industry norm. A mix of quality and average links. Fine to target. |
| TF is one-third of CF (3:1+) | Weak | Too many low-quality links dragging TF down. Investigate manually. |
| TF exceeds CF (ratio > 1) | Excellent | More trust than volume. Extremely clean link profile. |
| TF near 0 with high CF | Red flag | Almost always spam or manipulation. Skip it. |
The industry baseline is roughly 0.5 — TF being half of CF is considered average. Below 0.3, and the site has picked up a lot of low-quality links. Above 0.7, the link profile is unusually clean.
When you’re evaluating a guest post target, don’t just look at TF 25 and move on. Check whether CF is 28 or 90. Those are completely different sites with the same TF score.
Topical Trust Flow — The Most Overlooked Metric
Standard TF gives every trusted link the same weight regardless of topic. Topical Trust Flow breaks that down by category.
Majestic has classified over 800 topic pools, each anchored by seed sites within that category. A food blog getting links from recipe sites, food publications, and cooking channels will show high Topical TF under “Food & Drink.” The same TF score on a domain getting links from general news and unrelated directories tells a different story.
Why this matters: a backlink from a topically relevant authority is worth more than one from a generic high-authority site. Topical TF lets you measure that relevance at a glance, which generic TF hides.
When you’re in a specific niche, always check whether the prospective link site’s Topical TF category matches your own. A travel site with strong Topical TF in Travel beats a general news site with higher overall TF for a travel blog’s link profile.
Domain Rating (DR) and URL Rating (UR) — Ahrefs
DR and UR are Ahrefs’ answer to the same question: how strong is this site’s backlink profile? They show up in most all-in-one DA PA CF TF checkers alongside the Moz and Majestic data.
Domain Rating (DR)
DR is a domain-level PageRank calculation. Ahrefs publishes its methodology openly — unique referring domains count more than total backlinks, and link dilution applies. A DR 70 site linking to 5,000 domains passes less per link than one linking to five.
No spam signals, no content analysis, no domain age — just the link graph. That focus makes DR fast and responsive. Updates run every 12–24 hours, which makes it the most practical metric for tracking active link-building campaigns. DA won’t show you what DR shows you mid-campaign.
URL Rating (UR)
UR applies DR’s logic to one specific page rather than the whole domain. When you want to know how much link equity a particular article or landing page is carrying, UR is the number.
UR and PA both measure page-level authority but from different indexes and with different formulas. UR reacts faster to new links. PA is more stable but slower. Neither is more accurate — they’re pulling from separate crawled datasets and giving you slightly different reads on the same reality.
How to Use a DA PA CF TF Checker Properly
Most all-in-one checkers pull from Moz, Majestic, and sometimes Ahrefs APIs simultaneously. The mechanics are simple. Using the results properly takes a bit more thought.
Step 1 — Enter Your URLs
Paste one or more domains into the checker, one per line. Good bulk tools handle 10–50 URLs at once. Some premium versions go to 1,000. Enter domains without the https:// prefix unless the tool specifies otherwise.
Step 2 — Never Read a Score in Isolation
A site with DA 40, TF 9, CF 70 is sending you a clear warning. A site with DA 40, TF 32, CF 48 is a healthy prospect. Both have DA 40. The difference is everything else.
Always look at DA, TF, CF, and the ratio together before forming an opinion on a domain.
Step 3 — Calculate the TF/CF Ratio
Divide TF by CF. Above 0.5 is acceptable. Below 0.3 means you’re looking at a site with a lot of low-value links. Near zero with high CF is the clearest sign of spam or manipulation you’ll find in these metrics.
Step 4 — Verify with Traffic Data
High scores across all metrics paired with zero organic traffic is a major red flag. Sites with genuine authority rank for real keywords and send real traffic. If Ahrefs or SEMrush shows near-zero estimated traffic on a high-DR, high-TF domain, someone bought their way to those scores.
Always check traffic. It’s the one signal that’s hardest to fake at scale.
Step 5 — Export and Monitor Over Time
Download results as CSV. Save monthly snapshots for your own domains. TF and DA rising together over time confirms genuine authority growth. CF spiking without TF movement means someone acquired a batch of low-quality links. Catching that pattern early matters.
Which Metric to Use — Task by Task
You don’t need every metric for every task. Here’s exactly which to reach for based on what you’re trying to do:
| Task | Use This | Reason |
| Outreach / guest post vetting | DA + TF + Spam Score | DA for authority, TF for quality, Spam Score flags risky domains |
| Backlink prospecting | TF + DR | TF shows link quality, DR confirms backlink strength |
| Domain purchase / aged domain buy | All 6 metrics | Cross-check to catch inflated or manipulated scores |
| Competitor backlink audit | CF + TF + DR | Volume (CF), quality (TF), recency (DR) |
| Active link campaign tracking | DR + UR | 12-hr updates show campaign impact fast |
| Niche / topical site analysis | Topical TF | Category-specific TF beats generic scores for relevance |
| Toxic backlink detection | TF / CF ratio | A wide gap between CF and TF is the clearest warning sign |
| Quick free check | DA (Moz free tools) | MozBar and free DA checker need no subscription |
The combination most SEOs miss: TF + CF ratio for outreach vetting. Checking DA alone misses red flags that the ratio catches immediately. A site can look fine on DA and disastrous on TF/CF.
What Good Scores Actually Look Like
There’s no universal benchmark. Every metric is relative to your niche and who you’re competing against. That said, here are the ranges working SEOs use as starting filters:
For DA and PA
Most link building outreach targets a minimum of DA 30 for general content sites. In competitive verticals like finance, health, or SaaS, DA 50+ is where meaningful authority starts. New sites in narrow niches with DA 20–30 and clean spam scores can still be worth pursuing if the niche relevance is there.
For PA, anything above 20 on the specific page you want a link from is worth considering. Pages above 40 are strong targets.
For CF and TF
TF 20 with a ratio above 0.5 is a solid minimum for most outreach prospecting. TF 40+ puts a site in genuinely strong territory. Above TF 50, you’re dealing with established authorities in their category.
Never set a CF minimum threshold on its own. A CF of 80 with TF of 6 is a worse prospect than CF of 20 with TF of 15. The ratio is what you’re evaluating, not CF alone.
For DR and UR
DR 30+ is a common minimum for prospecting in most niches. Competitive verticals push that to DR 50+. For UR, anything above 20 on the specific target page indicates real link equity sitting on that URL.
Conclusion
DA, PA, CF, TF, DR, and UR are six different answers to the same question. None of them is the right answer on its own.
Use DA and PA when you need a broad authority signal for a domain or page. Use CF and TF together — never one without the other — and always calculate the ratio. Use Topical TF when your niche makes relevance the deciding factor. Use DR and UR when you need the fastest feedback during an active campaign.
The mistake isn’t picking the wrong metric. It’s trusting one number when the others are right there. Run the full check. Compare everything. Then open the actual website before you decide anything.